This brings together four decades of geospatial data on forest degradation across the eight Amazonian countries.
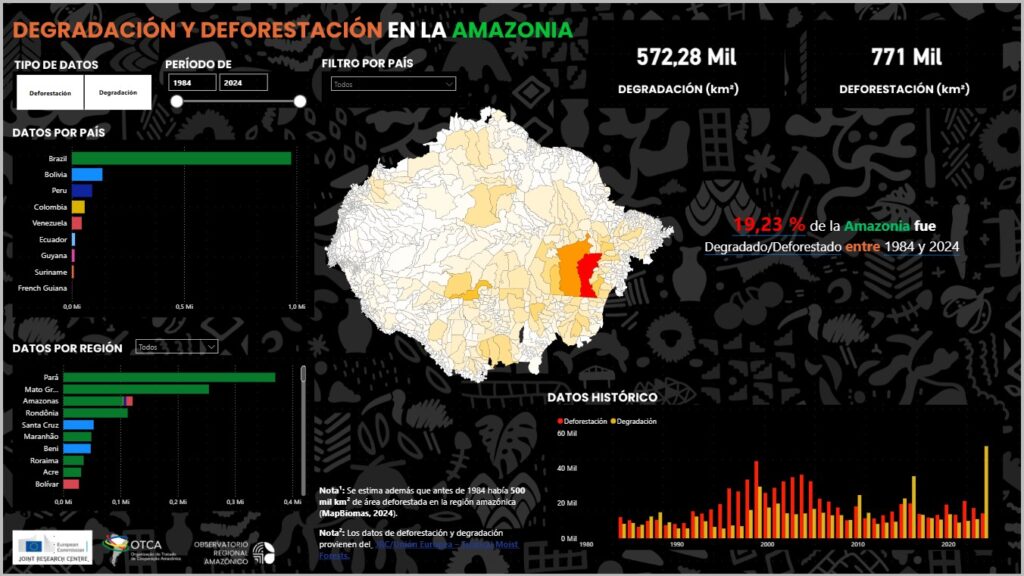
The Amazon Regional Observatory of OTCA (ARO/OTCA) launched last Thursday (28) the new Amazon Forest Degradation Panel, expanding the set of environmental monitoring tools available on the platform. The new interface brings together dynamic maps and charts presenting the historical time series of forest degradation data for the eight Amazonian countries (Bolivia, Brazil, Colombia, Ecuador, Peru, Guyana, Suriname, and Venezuela) from 1984 to 2024, enabling integrated spatial and temporal analyses. It also includes a specific analysis for all natural protected areas and Indigenous territories in the Amazon.
The degradation module now complements the deforestation data already made available by ARO. “Deforestation is the total removal of native vegetation cover, whereas degradation represents an intermediate process of forest impoverishment, without its complete destruction, as occurs, for example, in selective logging,” explains Maycon Castro, ARO Environmental Monitoring Specialist.
“Understanding degradation is essential because it often precedes different landscape trajectories. A degraded area may evolve into deforestation, move toward forest regeneration, or remain for long periods in a fallow state,” explains Tarsila Andrade, ARO geoprocessing specialist.
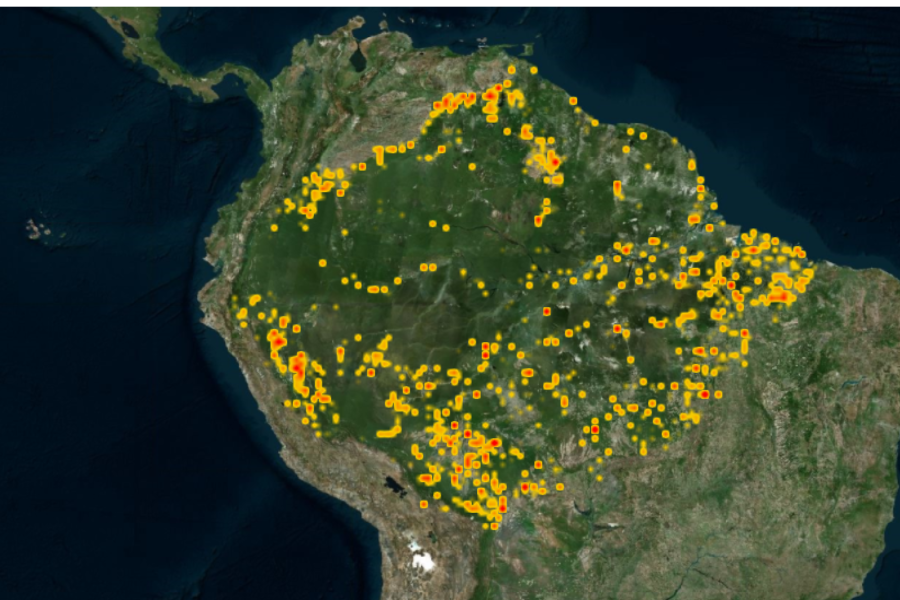
Forest degradation is more difficult to map than deforestation because, in some cases, it occurs while the forest is still standing. Its main drivers include forest fires—intensified in recent years by drought scenarios in the Amazon—selective logging, and the edge effect associated with landscape fragmentation. These processes reduce the forest’s capacity to provide ecosystem services such as climate regulation, biodiversity conservation, and maintenance of the hydrological cycle. Access to this type of information is strategic for supporting evidence-based public policies in Amazonian countries.
“Our analyses of degraded areas can even help distinguish illegal selective logging activities from those carried out legally under forest concessions,” says Arnaldo Carneiro, ARO coordinator.
Disturbance events
The data feeding the panel are based on the Tropical Moist Forests (TMF) product, developed by the European Union’s Joint Research Centre (JRC), which uses satellite imagery to monitor the evolution of tropical forests over time. Under the TMF methodology, an area is classified as degraded forest when it experiences up to three episodes of temporary loss of tree canopy over time. These events—caused by fire, logging, or other pressures—last at most about two and a half years and must be separated by periods of forest recovery.
When disturbances become more frequent—exceeding three occurrences—the area is no longer considered degraded and is instead counted as deforestation, starting from the first recorded impact. In the most recent years of the analysis, the system adopts additional criteria to distinguish degradation from deforestation, based on the quantity and consistency of satellite observations.
“This information allows us to see the Amazon in a more complete way, revealing not only where the forest has been cleared or degraded, but also where it is regenerating, since the universe of areas that were deforested and later abandoned is also important. This mapping should make it possible to identify both trajectories: from degradation to deforestation and from deforestation to regeneration. This broadens our capacity to interpret the region’s recent history and strengthens support for Amazonian countries in formulating evidence-based policies,” Carneiro states.
The new Forest Degradation panel is available under the “Deforestation” tab and then “Deforestation/Degradation,” where users can choose to analyze either forest degradation or deforestation data.
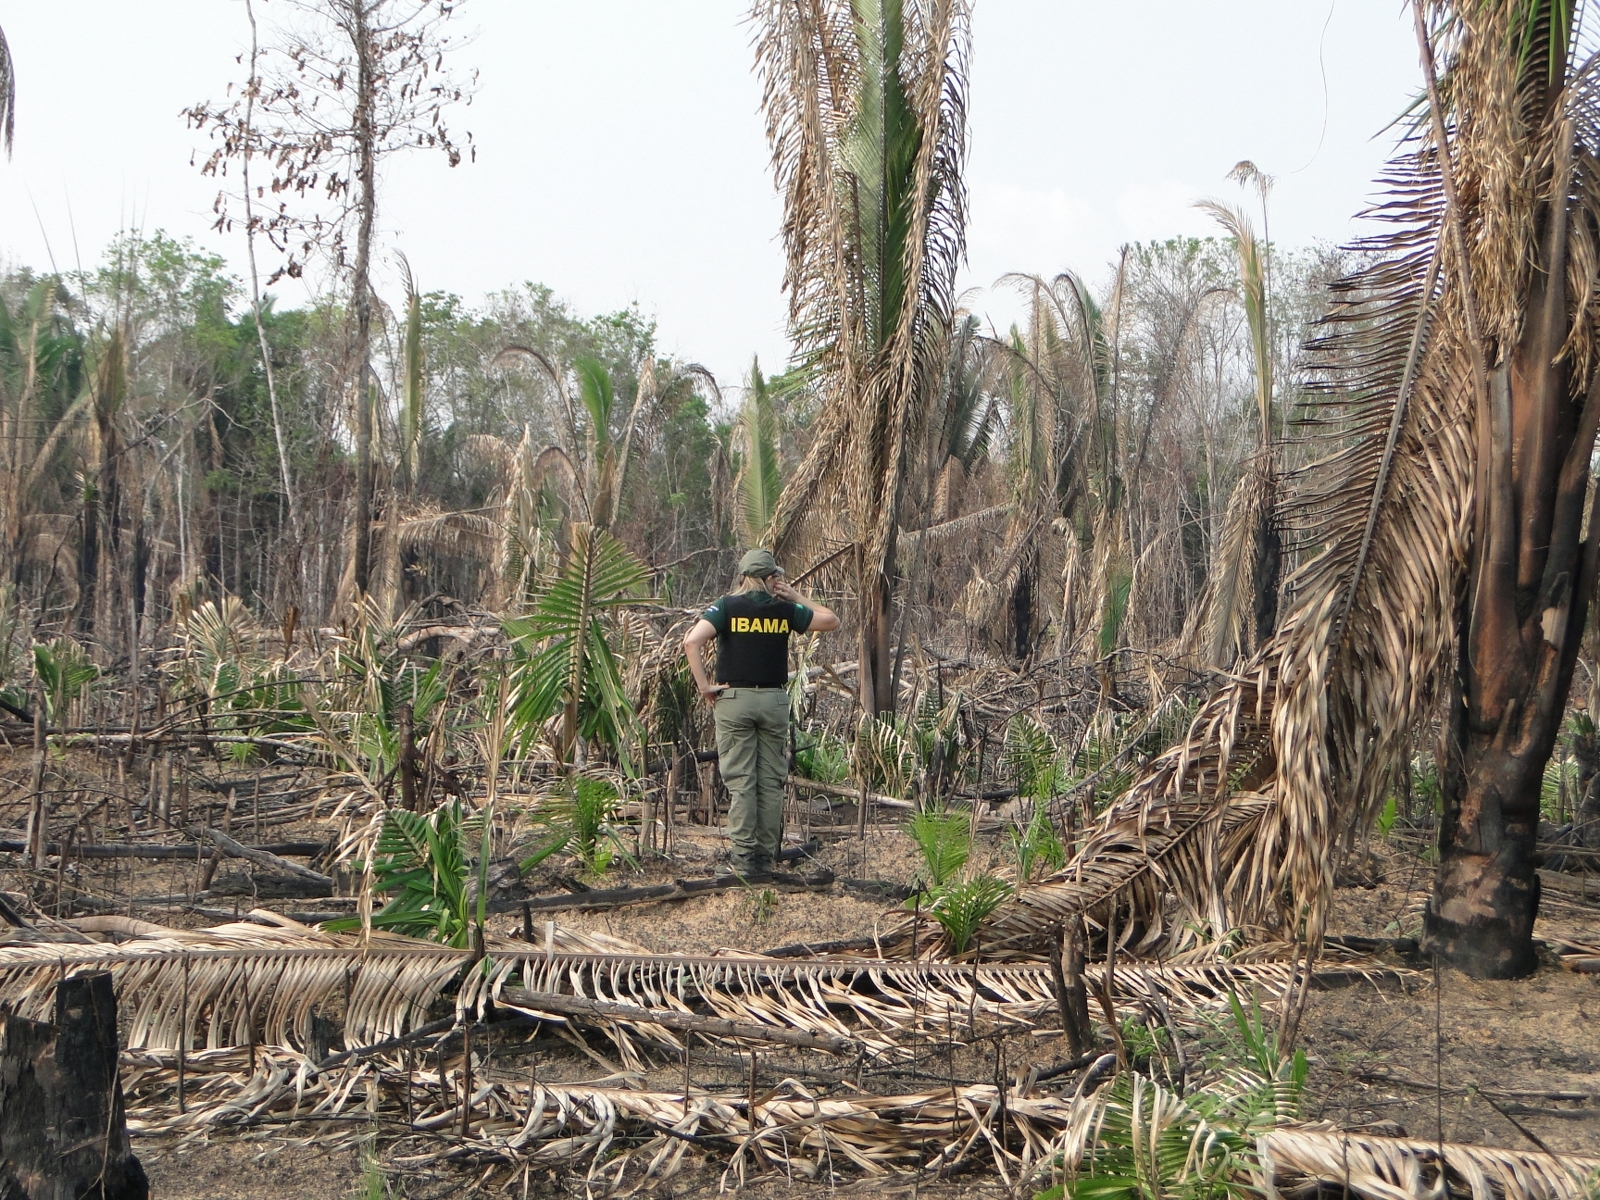
Photo: Illegally deforested area in Amazonas. Credit: Ditec_Ibama/AM / Ibama